
Margin
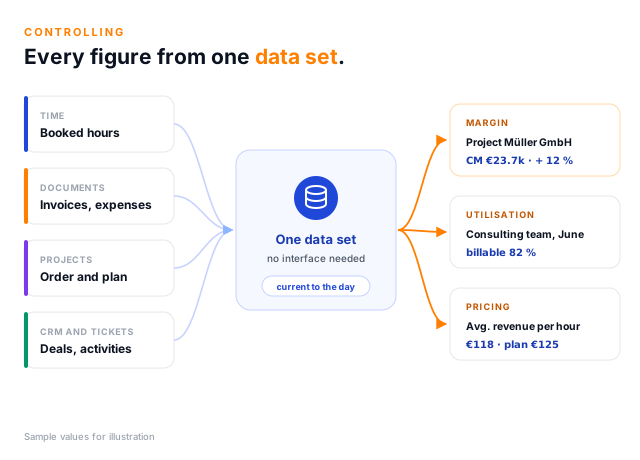
Is this project making money? teamspace calculates the contribution margin per project and per client continuously, from booked time, internal cost rates, documents and costs.
Controlling software analyses a company's time, costs and revenue so that management can steer by them. In teamspace those figures come from the same data set your team uses to book hours, run projects and write invoices. So you see whether a project makes money during the week it happens, not at the quarterly close.
What matters
A professional services firm sells its people's time and expertise. An hour nobody pays for cannot be put into stock. That is why controlling for service firms looks at three levers rather than unit costs.
Is this project making money? teamspace calculates the contribution margin per project and per client continuously, from booked time, internal cost rates, documents and costs.
How much of the available time was billable? The reports separate billable from non-billable hours, per employee, category and period.
Are we achieving the rates we calculated? Project and client analysis show the average revenue per hour, and the post-calculation shows the over- or under-recovery per order.
Why all three
At Bauer KG every consultant is booked until the end of the quarter. Utilisation looks fine, yet less is left at the end of the month than expected. The reason does not appear in any utilisation list: two fixed-price projects are running over budget, and a large client pays a rate below the average.
Anyone who sees only one of the three levers can easily pull the wrong one. In teamspace all three sit on the same data:
The key figures
Controlling for a service firm needs only a handful of key figures. In teamspace each of them comes from a ready-made report that works on the booked hours, invoices and documents, and a click on a total opens the bookings behind it. How management turns them into a cockpit with traffic lights is described under business steering.
One data set
Many service firms have long had their data in one system but analyse it somewhere else: in Excel, at the tax adviser's office or in the quarterly review. Accounting, project management and the directors then discuss three different sets of figures.
In teamspace, controlling is the analysis across all modules. Project hours come from time tracking, invoices and incoming invoices from the invoicing software, plans and budgets from project management, opportunities from the CRM and tickets from the service desk. Nobody transfers anything, and there is no interface to maintain.
One setting sits outside the reports: the internal cost rate per employee. You store it with a validity date in the HR area. Only then does a booked hour become a cost amount, and a later salary change leaves earlier months untouched.
The building blocks
Four building blocks describe the function itself, two more carry controlling into projects and sales. Each has its own page.
Cost accounting
Behind the contribution margin sits cost and performance accounting. Every project time entry, cost item, document line and posting gets three attributes: what kind of cost it is, where in the firm it arose and which project it belongs to. For time entries, cost items and document lines, a rule pre-fills them as the entry is made, so your team books exactly as before. How documents are checked and held against the plan on the project is described in the cost control process.
This gives two views of the same money. Contribution margin accounting asks what a project or client leaves over. Cost centre accounting asks what a department costs and how much of its time reaches clients.
Financial accounting stays with your tax adviser. Documents and invoices go across via the DATEV interface; controlling in teamspace is the management view alongside it.
How cost accounting is set up and used is described in the help centre, starting with the Introduction to cost accounting.
Choosing
Two rather different kinds of tool are sold as controlling software. Planning and finance software works forward from the accounts. teamspace works from the booked hour. Which one you need depends on what your result depends on.
Planning and finance software
From financial accounting and other upstream systems, usually by import or interface. The calculations run on accounts and periods.
teamspace
From day-to-day work: booked hours with an internal cost rate, invoices and documents on the project. There is nothing to import, because everything arises in the same system.
Planning and finance software
The company as a whole, with P&L, balance sheet and liquidity, and for groups the consolidated accounts too.
teamspace
Projects, clients, cost centres and your people's time. teamspace does not produce its own P&L or balance sheet; that stays with your tax adviser.
Planning and finance software
Usually after the month-end close, once accounting has delivered its figures.
teamspace
As soon as hours and documents are booked. Warning levels on the project report when a threshold is reached.
Planning and finance software
Controllers and the finance team, who build plans, scenarios and their own reporting models.
teamspace
Directors and project managers, who steer with ready-made reports.
Planning and finance software
you plan several companies, your bank wants to see integrated financial planning, or your controlling team needs to model freely.
teamspace
your result depends on how many of your people's hours get paid for, and at what rate.
The two do not rule each other out. If you already work with planning software, you can pass the project and client figures from teamspace on to it via Excel export or, from the enterprise edition, the REST API.
Each month
This is how the monthly conversation about the figures can run in teamspace, from a complete set of bookings to a decision.
All hours for the month are booked and approved. Documents and incoming invoices have been checked and carry cost type, cost centre and cost object.
The project analysis puts the loss-makers at the bottom. A click on a project shows the hours and costs behind the figure.
The post-calculation sets what was incurred and what was invoiced next to each order. If you see an under-recovery there, you price the next quote of that kind differently.
The 'Plan & analysis' tab of each cost centre shows plan and actual per month and since the start of the year, plus the cumulative variance.
Future revenue shows what is coming from orders and payment plans, complemented in the enterprise edition by the weighted sales forecast. Then the decision follows, for example to replan a project or to raise a change request.
Limits
teamspace does not include a report designer in which you click together your own data models and dashboards as in a BI tool. The reports are predefined. Within a report you choose columns, period, breakdown and filters, and save the result as a bookmark.
If you need more, there are three routes:
Your figures
Bring your monthly report along.
Show us the spreadsheet someone puts together by hand every month. In the call you will see which teamspace report delivers it, what needs to be set up for it and where the limits are.
Where the figures come from
Controlling works with what is recorded in day-to-day business anyway.
Every booked hour is valued at the internal rate and lands as cost on the project.
The project is the most common cost object, with plan, budget and contribution margin.
Outgoing and incoming invoices supply revenue and external costs at line level.
First call
Tell us what you steer your firm by today and which question remains open. We will show you where teamspace answers it from your own bookings.