
Period in one click
Quick filters such as last month or last year sit right above the table. For anything more precise there are from and to dates in the filter window.
Reporting is the fixed set of analyses a company uses to see regularly where it stands. In teamspace these are ready-made reports on projects, finance, staff, sales and tickets, all on the same data. You set the period and filters, and open the individual entries behind any total.
How it works
Whether invoicing analysis or ticket report, every report in teamspace works the same way. Your team learns the moves once.
Quick filters such as last month or last year sit right above the table. For anything more precise there are from and to dates in the filter window.
Breakdown splits the report by project, client or assignee into separate sub-lists. In the analyses, the Show setting decides what is totalled.
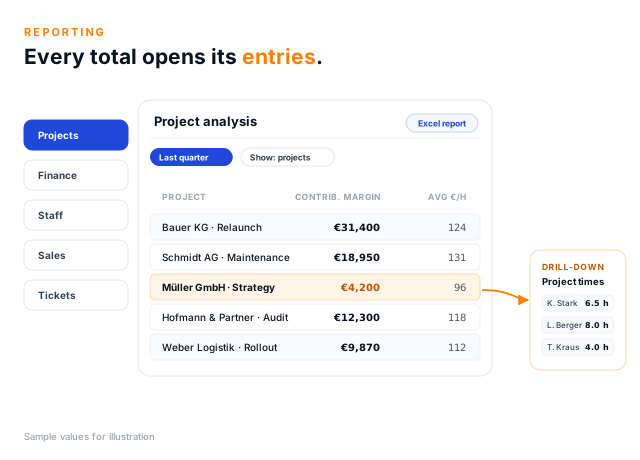
Drill-down opens the list behind a figure: from the invoicing analysis to the invoice lines, from the ticket analysis to the individual tickets.
Every report can be printed and exported as an Excel report. A bookmark saves filters and columns so the report opens the same way next time.
The reports
Most reports come in pairs: a list showing every entry individually and an analysis that totals them. Where each report sits in the menu is something you configure in your own account.
Projects
The project times report lists every booked hour with client, project, assignee and category, and can serve directly as an activity record. The project time analysis totals the same hours by week or month and puts planned and booked time side by side.
The project analysis calculates the contribution margin and the average revenue per hour from time, revenue and expenses. Sorted by contribution margin, the projects that no longer pay sit at the bottom. One click on the Müller GmbH project shows what the figure is made of.
Finance
The finance reports look in three directions. The invoicing analysis shows revenue and expenses per project or client over time, with booked or planned values as you choose. The financial analysis breaks everything down by source, that is invoice, incoming invoice, project time and cost item, and answers questions such as which client brought in the most revenue in the quarter.
Future revenue projects what can be expected in a coming period. Order confirmations, open order lines, payment schedules and the billing rules of your orders can all feed into it. Finally, the post-calculation sets each order against what was actually incurred on the project and what has already been invoiced. Any over- or under-recovery is clear when the order closes, not at year end.
On the cost side, the cost analysis and cost items reports show travel, expenses, commissions and materials, totalled or line by line.
Staff
The working time analysis totals weekly working time, holiday and sickness per employee; the working days report goes down to the individual day. In the enterprise edition, the capacity analysis sets available capacity against what is planned, with a line for the free time each day.
The employee analysis answers a different question: how much each person contributed to the margin of the projects they worked on. The commission report shows which commission is payable from booked project time, and the holiday report shows remaining leave at the turn of the year.
Sales, service, activities
For management
Management does not need every report, but a handful of figures it looks at every week. It helps to sort them by direction. Forward: is what we are building enough? Future revenue and the opportunity analysis show that. Back: how well did we do? The post-calculation and project analysis show that. Right now: are we looking after the right things? The project status analysis with its warnings shows that, as does the ad hoc report, which emails assigned tasks, warnings, follow-ups and new tickets without anyone asking.
How this becomes a dashboard with a few key figures and status lights is described on the business steering page. Before the monthly review, the Analyse with AI entry in a report's actions menu also helps: it reads the report on screen and points out what stands out. The figures in the report remain the basis; the AI analysis is a pointer. More under AI in teamspace.
That is how teamspace approaches AI in controlling: the AI reads and points things out, the calculating happens in the reports. The feature is included in every edition, runs on the AI connection your company enters itself and is switched on by your administrator. If you would rather ask in your own assistant, use the MCP server, for example in Claude with "Which invoices to Müller GmbH are still unpaid?". This requires a suitable MCP connection that has been configured and enabled for you, and that you are allowed to see those invoices in teamspace yourself.
Limits
The reports in teamspace are predefined. You adapt them through columns, period, breakdown, filters and report settings, and save your version as a bookmark. There is no designer in which you freely assemble your own data models and dashboards.
For analysis beyond that, you export to Excel or, from the enterprise edition, pull the data into a tool of your own via the REST API. How to build your own dashboard on it with an AI coding assistant is shown on the vibe coding page.
Your report
Which analysis do you build by hand today?
Bring the Excel list that is rebuilt every month. In the call we will show you the teamspace report that answers the same question, and which data needs to be maintained for it.
Within controlling
Reporting is one building block of controlling in teamspace.
The overview: margin, utilisation and rates from one data set.
Cost type, cost centre and cost object on every posting, as a column in the reports.
Pipeline, weighted forecast and client analysis for sales.
First call
Tell us which figures your management wants to see every month. We will show you which teamspace reports deliver them and how to keep them to hand as bookmarks.